In this project I take Nashville raw housing data and transform
it in SQL Server to make it more usable for analysis.
(using join,
substring, case statement, CTE and window functions)

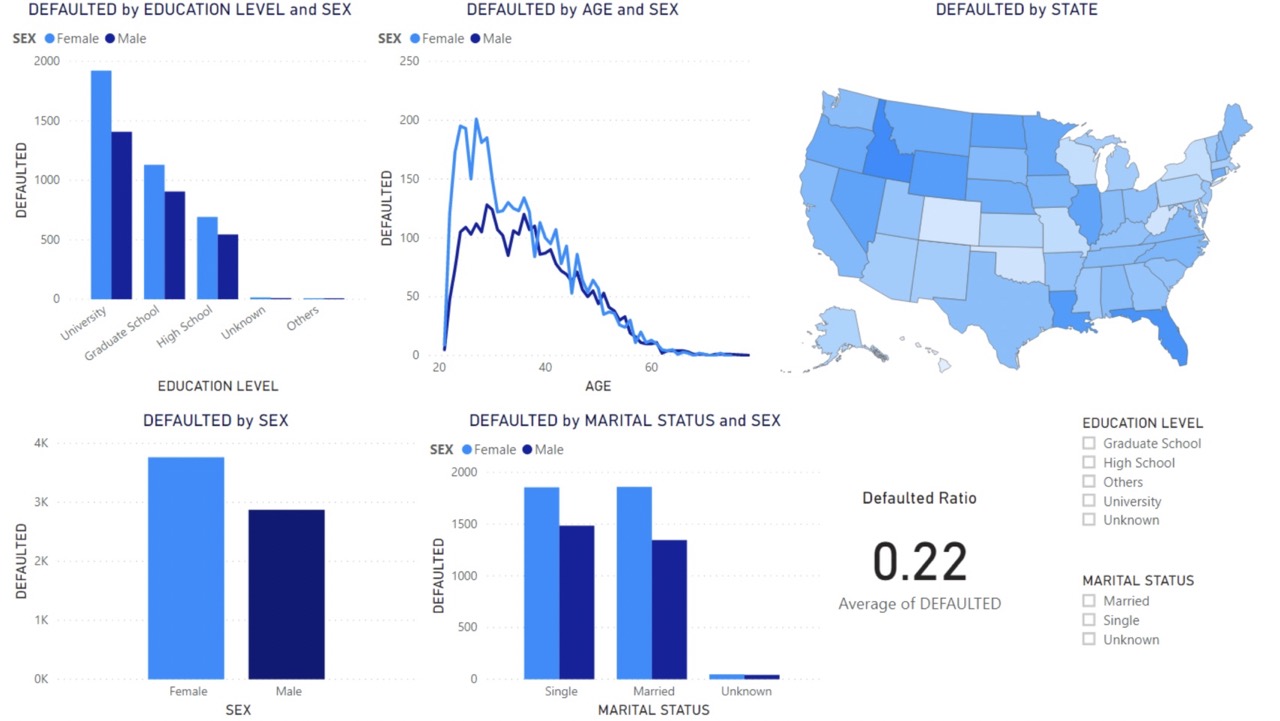
In this project I use Power BI to analyze and visualize data of default payments, demographic factors and credit data of credit card clients from data available in UCI.EDU Machine Learning Repository.

In this project I use SQL Server to explore uptodate global COVID 19 data from "Our World in Data" website.
(using joins, CTE, temp tables, windows functions, aggregate functions and data convertion)

In this project I look at what variables effect the gross revenue from movies.
(using pandas, numpy, seaborn and matplotlib libraries)
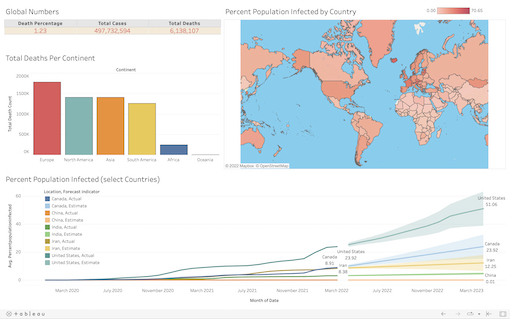
In this project I used Tableau dashboard to visualize data from the Covid19 data I analysed before in SQL. (best viewed full screen)
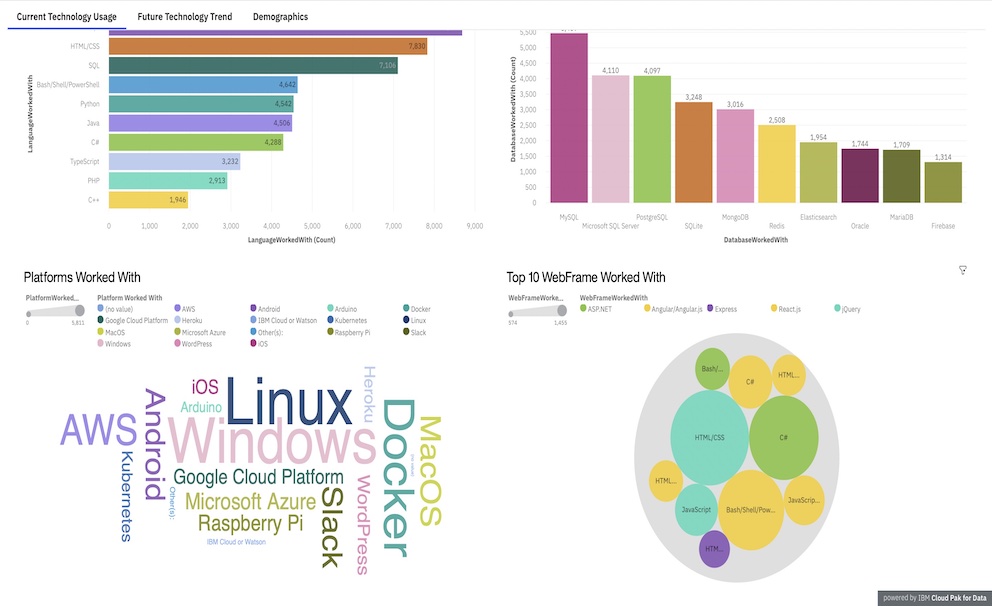
In this project as part of my certification I analysed current and future technology trends and demographics and visualized them in three tabs in Cognos Analytics.

